Many applications log information to text files instead of standard logging services such as Windows Event log or Syslog.
This post explains how to collect text logs via Azure Monitor Agent from source virtual machines and sending these logs to a custom table in an Azure Log Analytics Workspace using a Data Collection Rule (DCR).
Managing tables in a Log Analytics workspace.
A Log Analytics workspace lets you collect logs from Azure and non-Azure resources into a single centralized space for purposes such as data analysis and for use by other services such as Sentinel, as well as Logic Apps. The Log Analytics workspace consists of tables, which you can configure to manage your data model and log-related costs.
The aim of this walkthrough is to explain how to ingest custom source data (eg: a server-based 3rd party application log file) into a custom created table in Azure.
The following steps are described in this post:
- The creation of the destination Azure Log Analytics Workspace.
- The creation of the destination custom table in the Azure Log Analytics Workspace.
- We identify the custom source data that we plan to ingest and edit the destination custom table schema to accommodate our source data.
- The creation of a Data Collection Endpoint (Private Endpoint) before provisioning the DCR as this is required for the ingestion of custom data.
- The creation of a Data Collection Rule (DCR) to automate the collection of the source data from the server-based application and send it to the destination custom table in the Log Analytics Workspace.
- Verification of our ingested data inside our custom table.
Permissions:
- You will need contributor rights on the destination Log Analytics Workspace.
- You will also need contributer or deployment rights on the resource group into which you plan to deploy the DCR (and mandatory DCE which is required for custom data collection.
Step 1 – Provision the destination Log Analytics Workspace which will hold the custom table
Once you have provisioned the destination Log Analtyics Workspace, its time to look at the table options.
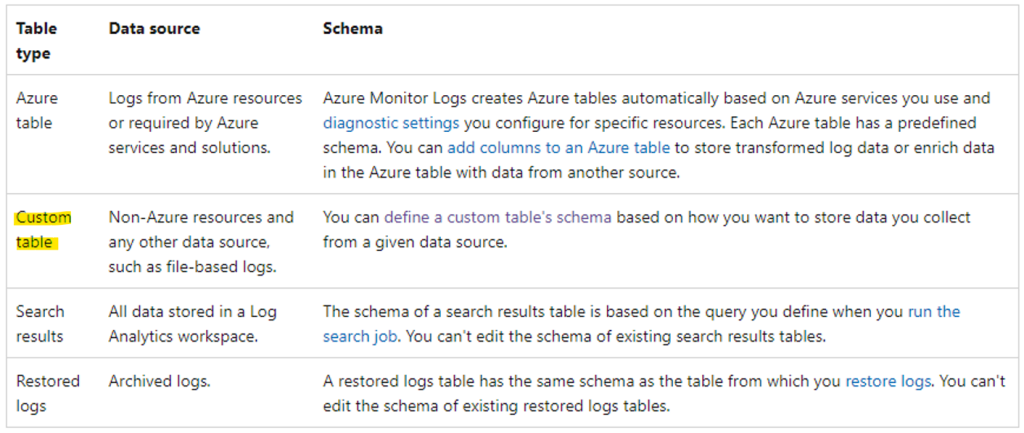
Your Log Analytics workspace can contain the following types of tables. (This post focuses on the custom table).
Step 2 - Create the Custom Table
Use the Powershell script below to quickly and easily provision your bespoke custom table.
Customize the following elements in the powershell script:
subscription, resource group, and custom table name (leave the _CL appendix as all custom tables are appended with this appendix by default)
$tableParams = @'
{
   "properties": {
       "schema": {
              "name": "AllenCustomSecurity3_CL",
              "columns": [
       {
                               "name": "TimeGenerated",
                               "type": "DateTime"
                       },
                      {
                               "name": "RawData",
                               "type": "String"
                      }
             ]
       }
   }
}
'@

Invoke-AzRestMethod -Path "/subscriptions/<subscriptionID>/resourcegroups/rg-allen/providers/microsoft.operationalinsights/workspaces/loganalyticswrkspace01/tables/AllenCustomSecurity3_CL?api-version=2021-12-01-preview" -Method PUT -payload $tableParams
Press Enter to execute the powershell code.
You should see a 200 response, and details about the table you just created will show up.

If you see a 404 response, then your deployment has failed. Review your script and check for typo’s | trimming| spaces.

Verification
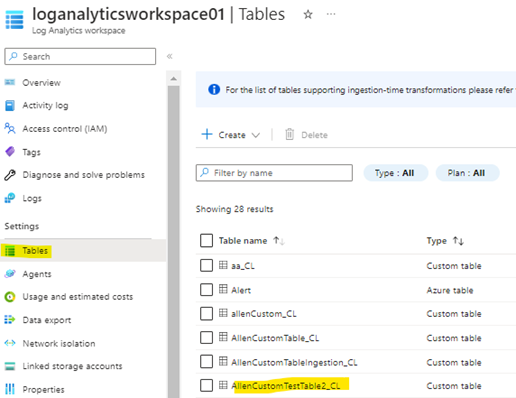
To validate that the custom table was created, go to your destination workspace and select Tables on the left blade. You should see your table in the list.
1. Go to your target Log Analytics Workspace > Tables > find your newly deployed custom table.
Step 3 – Customize the Custom Table Schema
Table type and schema
A table’s schema is the set of columns that make up the table into which Azure Monitor Logs collects log data from one or more data sources.
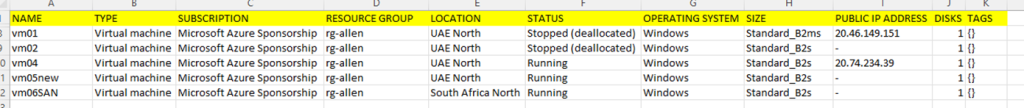
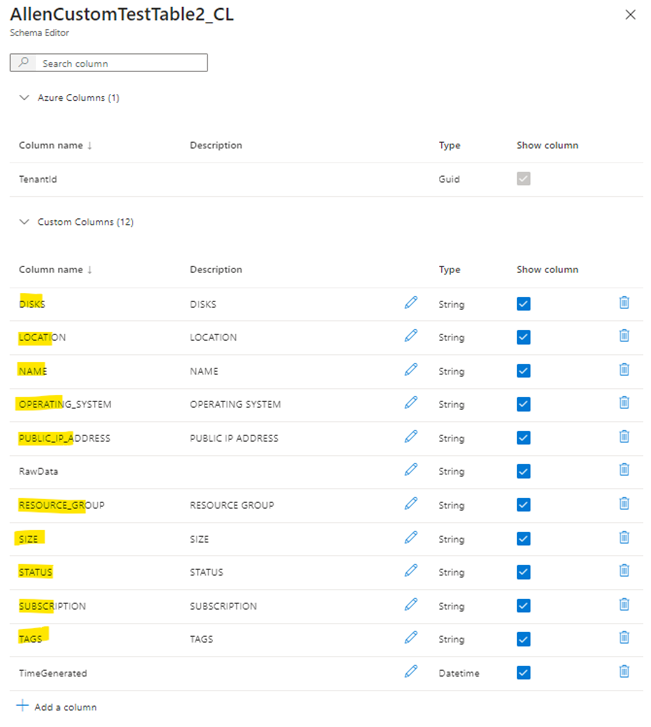
For this post Im going to seed my custom table AllenCustomTestTable2_CL with a simple AzureVirtualMachines.csv that I have downloaded and pasted into a source folder on a server in the location C:\custom\AzureVirtualMachines.csv. This is the source file that will be parsed into the custom table.
The column headings on this AzureVirtualMachines.csv will need to be added to the AllenCustomTestTable2_CL custom table.
Select the destination custom table you have created and select Edit schema
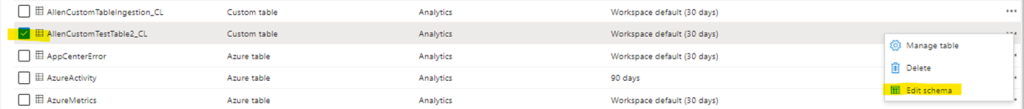
Select Add column and add the column heading names in accordance to your source data (my example has NAME,TYPE,SUBSCRIPTION,RESOURCE GROUP,LOCATION,STATUS,OPERATING SYSTEM,SIZE,PUBLIC IP ADDRESS,DISKS,TAGS).
Make sure to add the Type correctly to ensure your data displays correctly > Save
Step 4 – Create the DCE (Data collection endpoints)
Before we start, keep in mind that the DCE must be deployed in the same region as the source virtual machines,
While the DCR must be deployed in the same region as the destination Log Analytics Workspace.
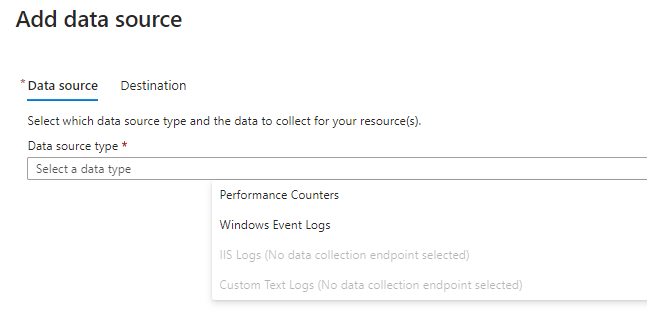
We must pre-create the DCE before provisioning DCR. The DCE is mandatory for custom data collection. Without the DCE, the DCR will not display the option of custom text logs in the data source tab.
Restrictions when provisioning your DCE’s:
Data collection endpoints (DCE’s) are Azure Resource Manager resources created within specific regions. An endpoint in a given region can only be associated with the source machines in the same region. However, you can have more than one endpoint within the same region according to your needs.
Data collection endpoints (DCE’s) only support Log Analytics workspaces as a destination endpoint for collected data.
DCE’s also can’t be configured to run over private links.
How to create our Data Collection Endpoint (DCE)?
Remember that for (virtual machine) agents that need to connect to our DCE, the DCE must be created in the same region as our vms. If we have agents in different regions, we will need multiple DCEs scoped per region.
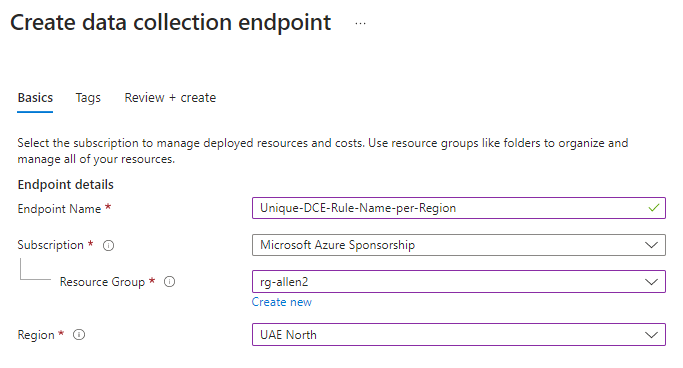
1. On the Azure Monitor > select Data Collection Endpoints > Create to create a new DCE and assignment. (Or search for Data Collection Endpoints from the Homepage).
2. Provide a Unique Rule name and specify a Subscription, Resource Group, and Region > Select Review + create. * Remember that your DCE is scoped to a region so try to include the region name in your unique naming convention to avoid ambiguity later when you have multiple DCE’s to choose from.
Step 5 – Create a Data Collection Rule (DCR) to collect text logs
Lets create the Data Collection Rules (DCR) to define how to collect, transform, and send the data to a custom table in our Log Analytics workspace. DCR’s automate this ETL process going forward.
The DCR defines:
1. The source log files and their location which the Azure Monitor Agent will scan and ingest for new events.
2. How Azure Monitor transforms events during ingestion as per the DCR settings.
3. The destination Log Analytics Workspace and destination custom table to which Azure Monitor will send the data.
*You can define a data collection rule (DCR) to send data from multiple machines to multiple Log Analytics workspaces, including Workspaces in a different region or tenant. The data collection rule (DCR) must however be created in the same region as your destination Log Analytics workspace. If you want to send data across to a different tenant, then you will need to enable Azure Lighthouse.
How to create our Data Collection Rule (DCR)?
- Create the DCR in the Azure portal via Monitor > Data Collection Rules
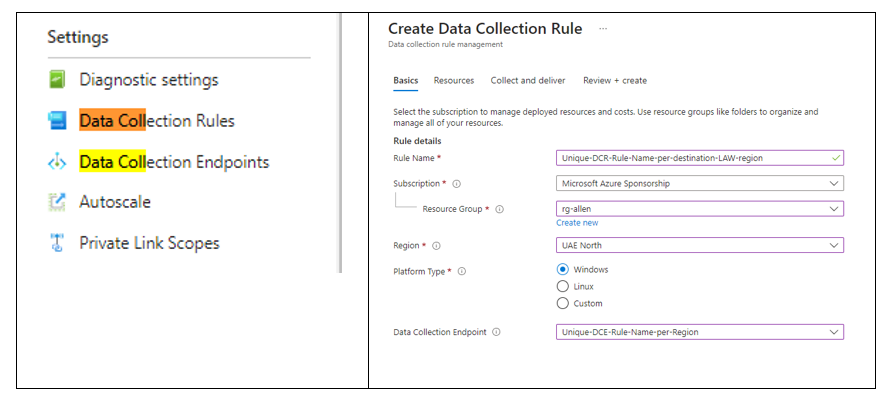
- On the Monitor > select Data Collection Rules.
- Select Create a new Data Collection Rule and associations.
- Enter a Unique rule name and specify a Subscription, Resource Group, Region, Platform Type, and Data Collection Endpoint:
Region > the DCR must be created in the same region as the destination LAW
Platform Type > specifies the type of resources / virtual machines that this rule can apply to.
The Custom option allows for both Windows and Linux types.
Data Collection Endpoint is required to collect custom logs.
Add the pre-created DCE (from step 4)
Next: Resources Tab

On the Resources tab:
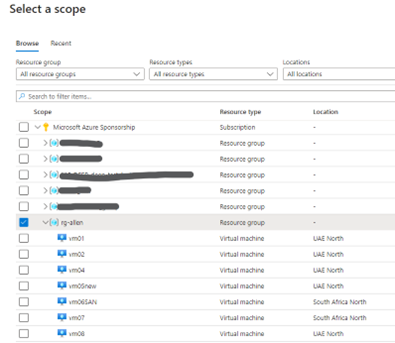
Select + Add resources to the data collection rule.

Resources can be virtual machines, Virtual Machine Scale Sets, and Azure Arc for servers. The Azure portal installs Azure Monitor Agent on resources that don’t already have the AMA installed.
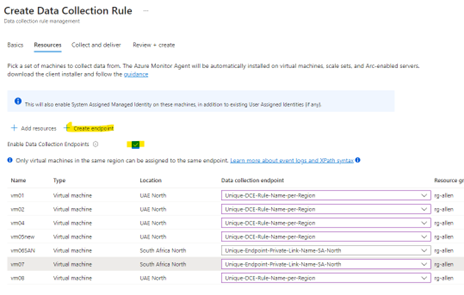
Data Collection Endpoint is required to collect custom logs.
Select Enable Data Collection Endpoints.
Select a data collection endpoint for each of the resources associate to the data collection rule.
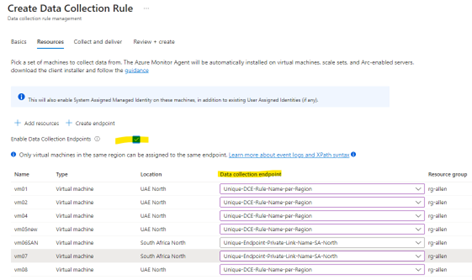
You will need network isolation using private links, (if you have not pre-created your DCEs as yet, you must do so now), then select the endpoint from the same region for the respective resources or create a new endpoint.
Collect and deliver tab >
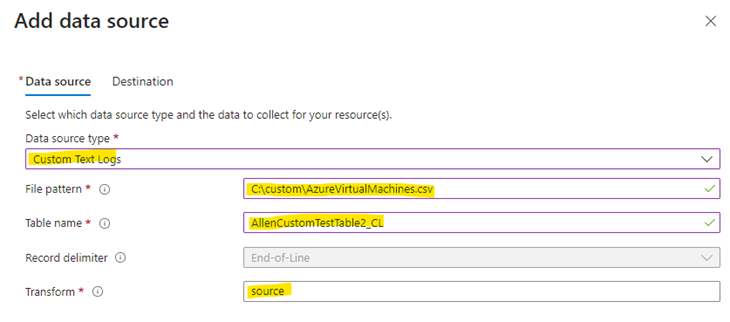
select Add data source >
Select Custom Text Logs
File Pattern – Identifies the log files location on the local disk. You can enter multiple file patterns separated by commas. (This is where I added my source file location, which is located on the source virtual machines which have been added as Resources in the DCR – C:\custom\AzureVirtualMachines.csv)
Table name – The name of the destination table we created in the Log Analytics Workspace.
Record delimiter – Not active at this time, (this will be used in the future to allow delimiters other than the currently supported end of line (/r/n)).
Transform – If you are not using ingestion-time transformation then leave the default value as source if you don’t need to transform the collected data.
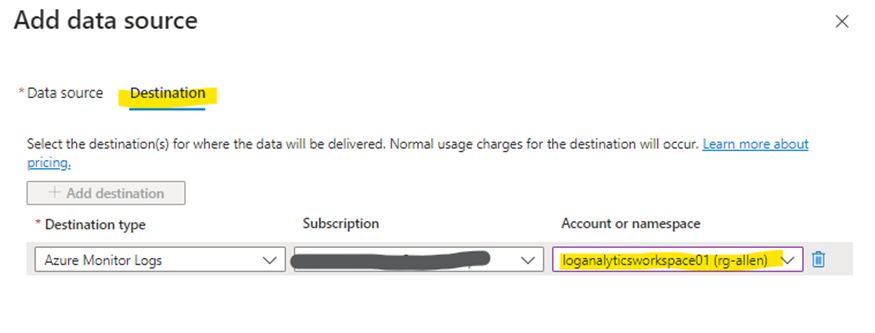
On the Destination tab >
Add / verify the LAW destinations. You can select multiple destination Log Analytics workspaces which is also known as multihoming.
When you validation passes, then click on Review + create
Step 6 - Verification \ Troubleshooting
Microsoft documentation states that it can take up to 5 minutes for data to be sent to the destinations custom table after you provision the data collection rule (DCR).
In my experience the table takes around 30-60 minutes to pull the source data and update the new custom table, so be patient.
Here are some great verification \ troubleshooting steps you can run to ensure that your configuration is correctly deployed:
Go to your Log Analytics Workspace > Logs >
Run a search on your custom table. You should see data being parsed as per your KQL query.
Start by checking if any records have been collected for your custom log table by running the following query in Log Analytics. It can take several minutes for new data to be uploaded into your new custom tables.
Its important to note that only new data that has been updated in the source file since after the DCR was deployed will be uploaded. You cannot use old static data! Old static data will not upload into the custom table.
Any log files updated to prior to deploying the DCR rules being created won't be uploaded into the custom table! Hence, don’t use old data!
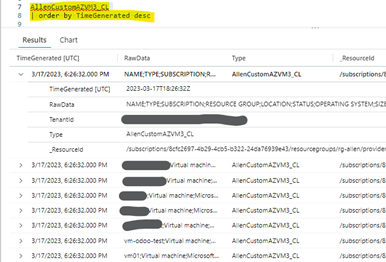
Run the following KQL query on your custom database to get a result resembling below:
<YourCustomLog>_CL
| order by TimeGenerated desc
If Step 1 isnt working yet, verify that the source virtual machine agent is sending heartbeats successfully.
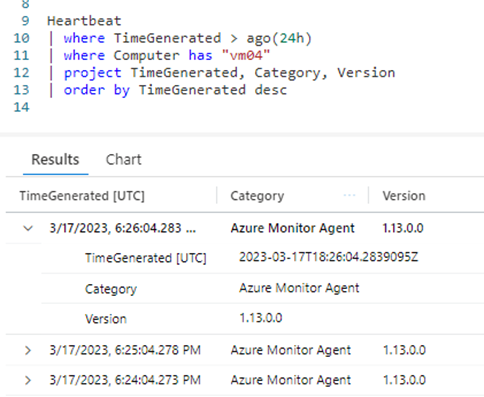
Verify that Azure Monitor Agent is communicating properly by running the following query in Log Analytics to check if there are any records in the Heartbeat table.
Heartbeat
| where TimeGenerated > ago(24h)
| where Computer has “vm04”
| project TimeGenerated, Category, Version
| order by TimeGenerated desc
If you get the output below, then the source vm in the DCR is communicating successfully via the AMA agent.
If Step 2 is success but Step 1 is still failing, then verify that you have indeed specified the correct source custom data log location in the data collection rule (DCR).
Make sure the unc path on the source vm matches the unc on the DCR.
The data collection rule will have a section similar to the following.
The filePatterns element specifies the path to the log file to collect from the agent computer. Check the agent computer to verify that this is correct.
(There may be a syntax error in the script below. I have not managed to get this script working as yet but will update when I do).
"dataSources": [{
            "configuration": {
                "filePatterns": ["C:\\custom\\AzureVirtualMachines*.csv"],
                "format": "text",
                "settings": {
                    "text": {
                        "recordStartTimestampFormat": "yyyy-MM-ddTHH:mm:ssK"
                    }
                }
            },
            "id": "myTabularLogDataSource",
            "kind": "logFile",
            "streams": [{
                    "stream": "Custom-TabularData-ABC"
                }
            ],
            "sendToChannels": ["gigl-dce-00000000000000000000000000000000"]
        }
    ]
Microsoft Reference:
https://learn.microsoft.com/en-us/azure/azure-monitor/agents/data-collection-text-log?tabs=portal
WONDERFUL Post.thanks for share..more wait .. ?
Great post but I was wanting to know if you could write a litte more on this subject? I’d be very thankful if you could elaborate a little bit further. Many thanks!
Collecting custom text logs with Azure Monitor Agent – Allen on Azure
avxgyhrbtxc
vxgyhrbtxc http://www.g8n4ib7c9f1t0nb0tpj359rr76z714d8s.org/
[url=http://www.g8n4ib7c9f1t0nb0tpj359rr76z714d8s.org/]uvxgyhrbtxc[/url]
Hi Allen, this a great and very helpful article. Thank you!!! Would you happen to know if Azure DevOps Pipeline Microsoft Self-Hosted Agents can be used a source in the Data Collection Rules? Thanks in advance! MM
Thanks for any other excellent post. Where else may anybody get that kind of information in such a perfect approach of writing? I’ve a presentation next week, and I am at the search for such information.
Please tell me more about this. May I ask you a question?
Thanx for the effort, keep up the good work Great work, I am going to start a small Blog Engine course work using your site I hope you enjoy blogging with the popular BlogEngine.net.Thethoughts you express are really awesome. Hope you will right some more posts.
We are a group of volunteers and opening a new scheme in our community.
Your site offered us with valuable information to work on.
You have done a formidable job and our entire community
will be thankful to you.