The aim of this post is to easily apply XPath filtering to your virtual machine event logs being collected. This is great for collecting relevant and useful Event ID logs from your virtual machines.
The components of this post:
Step 1 – Create the DCE (Data collection endpoints)
Step 2 – Create a Data Collection Rule (DCR)
You can define a data collection rule (DCR) to send data from multiple machines to multiple Log Analytics workspaces (multihoming), which may be in different regions or different tenants. The only requirement is to create the data collection rule in the same region as your Log Analytics workspace. If you want to send data across to a different tenant, then you will need to enable Azure Lighthouse.
Step 1 – Create the DCE (Data collection endpoints)
Before we start, keep in mind that:
The DCE must be deployed in the same region as the source virtual machines;
And the DCR must be deployed in the same region as the destination Log Analytics Workspace.
We must pre-create the DCE before provisioning DCR. The DCE is mandatory for custom data collection. Without the DCE, the DCR will not display the option of custom text logs in the data source tab later on when we provision the DCR.

Restrictions when provisioning your DCE’s:
Data collection endpoints (DCE’s) are Azure Resource Manager resources created within specific regions. An endpoint in a given region can only be associated with the source machines in the same region. However, you can have more than one endpoint within the same region according to your needs.
Data collection endpoints (DCE’s) only support Log Analytics workspaces as a destination endpoint for collected data.
DCE’s also can’t be configured to run over private links.
How to create our Data Collection Endpoint (DCE)?
Remember that for (virtual machine) agents that need to connect to our DCE, the DCE must be created in the same region as our vms. If we have agents in different regions, we will need multiple DCEs scoped per region.
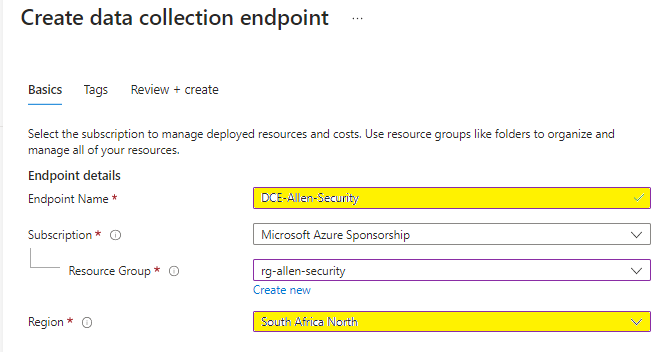
1. On the Azure Monitor > select Data Collection Endpoints > Create to create a new DCE and assignment. (Or search for Data Collection Endpoints from the Homepage).
2. Provide a Unique Rule name and specify a Subscription, Resource Group, and Region > Select Review + create. * Remember that your DCE is scoped to a region so try to include the region name in your unique naming convention to avoid ambiguity later when you have multiple DCE’s to choose from.
Step 2 – Create a Data Collection Rule (DCR)
Lets create the Data Collection Rules (DCR) to define how to collect, transform, and send the data to a custom table in our Log Analytics workspace. DCR’s automate this ETL process going forward.
The DCR defines:
1. The source log files and their location which the Azure Monitor Agent will scan and ingest for new events.
2. How Azure Monitor transforms events during ingestion as per the DCR settings.
3. The destination Log Analytics Workspace to which Azure Monitor will send the data.
How to create our Data Collection Rule (DCR)?
- Create the DCR in the Azure portal via Monitor > Data Collection Rules

- On the Monitor > select Data Collection Rules.
- Select Create a new Data Collection Rule and associations.
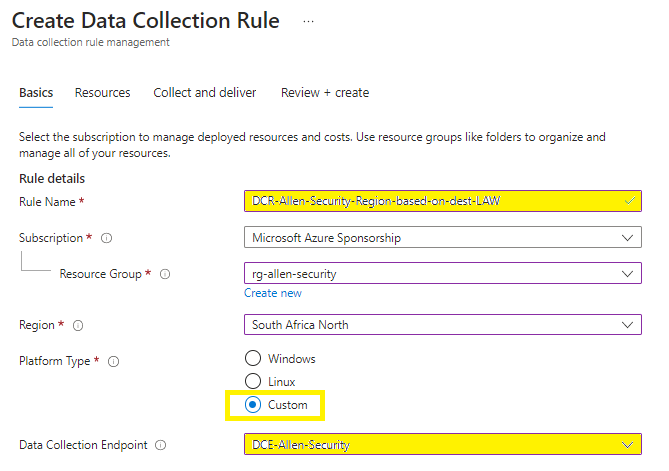
- Enter a Unique rule name and specify a Subscription, Resource Group, Region, Platform Type, and Data Collection Endpoint:
Region > the DCR must be created in the same region as the destination LAW
Platform Type > specifies the type of virtual machines OS that this rule can apply to.
The Custom option allows for both Windows and Linux types.
Data Collection Endpoint is required to collect custom logs.
Add the pre-created DCE (from step 4)
Next: Resources Tab
On the Resources tab:
Select + Add resources to the data collection rule.

Resources can be virtual machines, Virtual Machine Scale Sets, and Azure Arc for servers. The Azure portal installs Azure Monitor Agent on resources that don’t already have the AMA installed.

Data Collection Endpoint is required to collect custom logs.
Select Enable Data Collection Endpoints.
Select a data collection endpoint for each of the resources associate to the data collection rule.
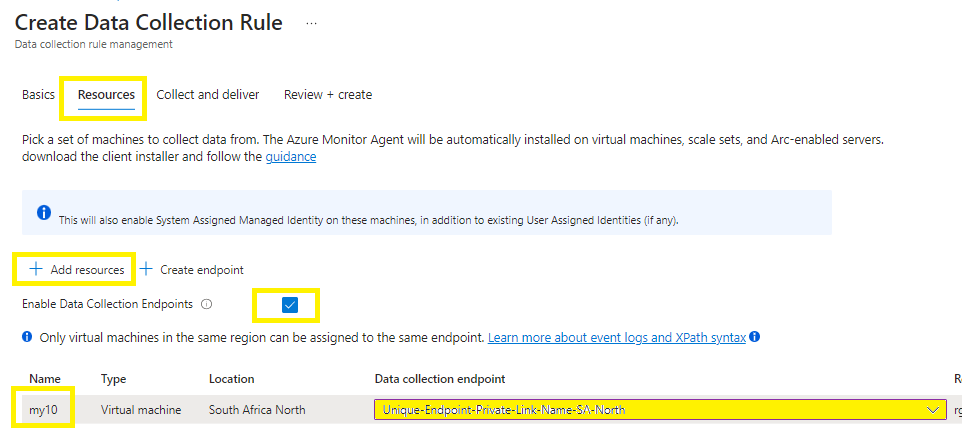
You will need network isolation using private links, (if you have not pre-created your DCEs as yet, you must do so now), then select the endpoint from the same region for the respective resources or create a new endpoint.
Step 3 – Filter events using XPath queries
You are charged for all data that you ingest into a Log Analytics workspace. Thus you should minimize the volume of event data collected.
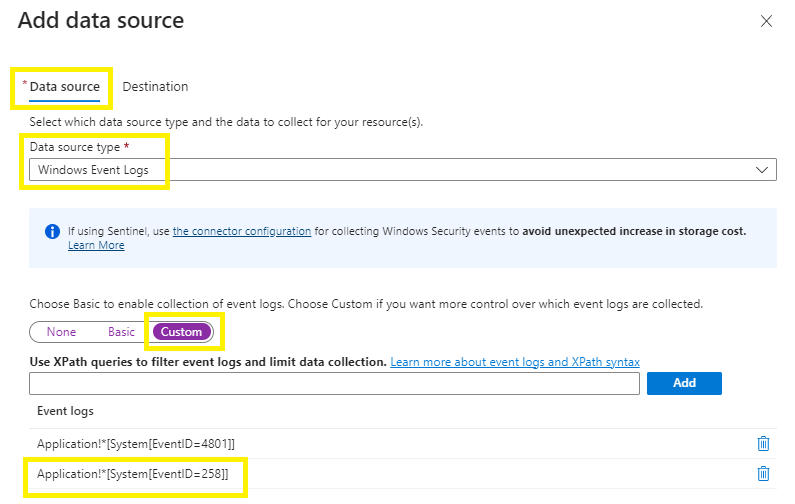
To specify filters, use custom configuration and specify an XPath that filters out the events you don’t need.
To filter on Event IDs, select the Data Source = Windows Event Logs,
Log collections = Custom,
Add your custom XPath queries as per you bespoke requirements > Add.
I have created 2 entries as per below to filter on 3 event IDs as an example after reviewing the event ID’s being generated by my source vm.
Im adding EventID 258 and then running hard disk defrag / optimization to quickly and easily generate an application event log.
Application!*[System[EventID=258]]
Security!*[System[EventID=4688]]
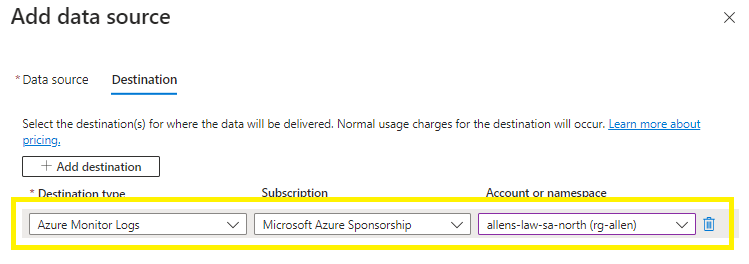
On the Destination tab >
Add / verify the LAW destinations. You can select multiple destination Log Analytics workspaces which is also known as multihoming.
When you validation passes, then click on Review + create
Step 4 - Verification \ Troubleshooting
Microsoft documentation states that it can take up to 5 minutes for data to be sent to the destinations custom table after you provision the data collection rule (DCR).
In my experience the table takes around 30-60 minutes to pull the source data and update the new custom table, so be patient.
Here are some great verification \ troubleshooting steps you can run to ensure that your configuration is correctly deployed:
Go to your Log Analytics Workspace > Tables > Events
Run a search on your destination table. You should see data being parsed as per your KQL query or you would be seeing ingestion into Sentinel in the next few minutes.
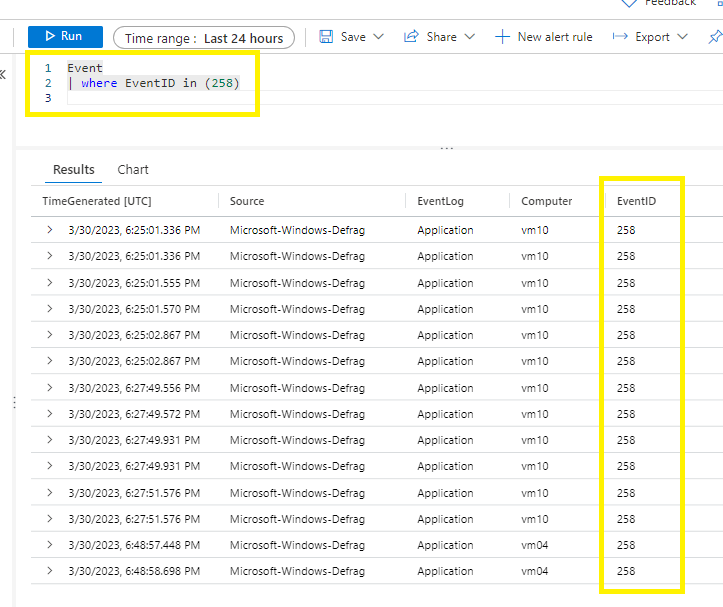
Event
| where EventID in (258)
Events from Windows Event Logs on Windows computers are stored in the Event table in the Log Analytics Workspace
You should participate in a contest for the most effective blogs on the web. I will suggest this web site!
Right here is the right website for anybody who really wants to understand this topic.
You understand so much its almost tough to argue with you (not that I actually
would want to…HaHa). You definitely put a fresh spin on a
topic that’s been discussed for a long time. Great stuff,
just wonderful!