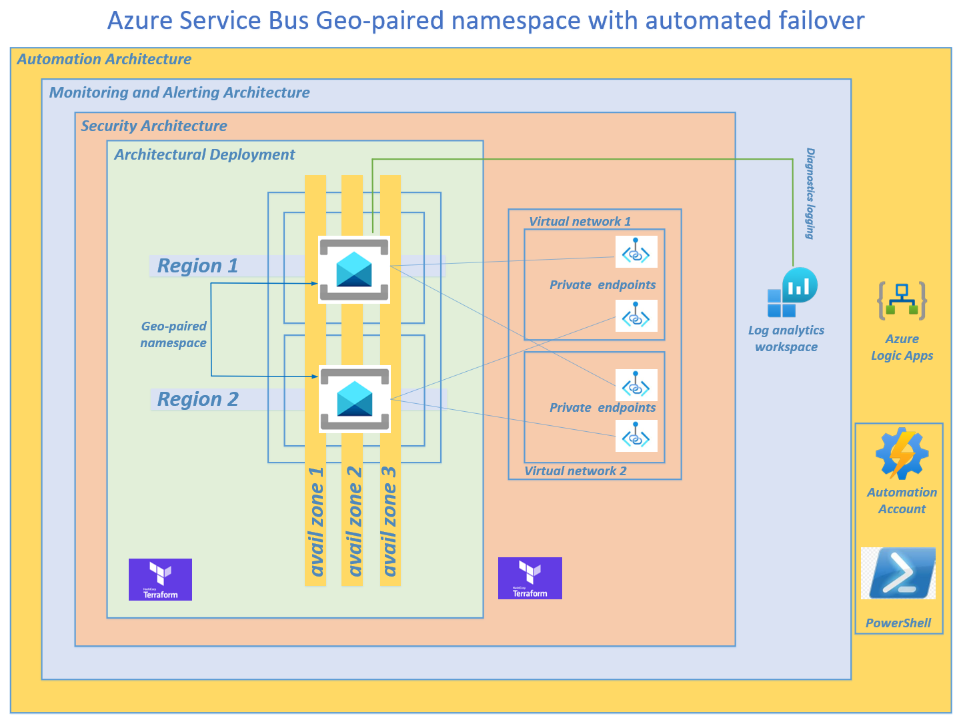
I was recently asked by a client to provision an automated failover solution for their geo-paired Azure Service Bus namespace, whereby an alert is automatically generated and sent via email or Microsoft Teams to a reviewer. The reviewer can then immediately grant approval to activate the automated failover to the secondary namespace and break the pairing, following best practices.
The architectural components are deployed via Terraform and PowerShell for Infrastructure as Code (IaC) to satisfy the DevOps requirements.
By default, Microsoft describes manually failing over the geo-paired Azure Service Bus namespace due to the interconnected subsystems or infrastructure.”
The Terraform script can be found here
Deployment Plan
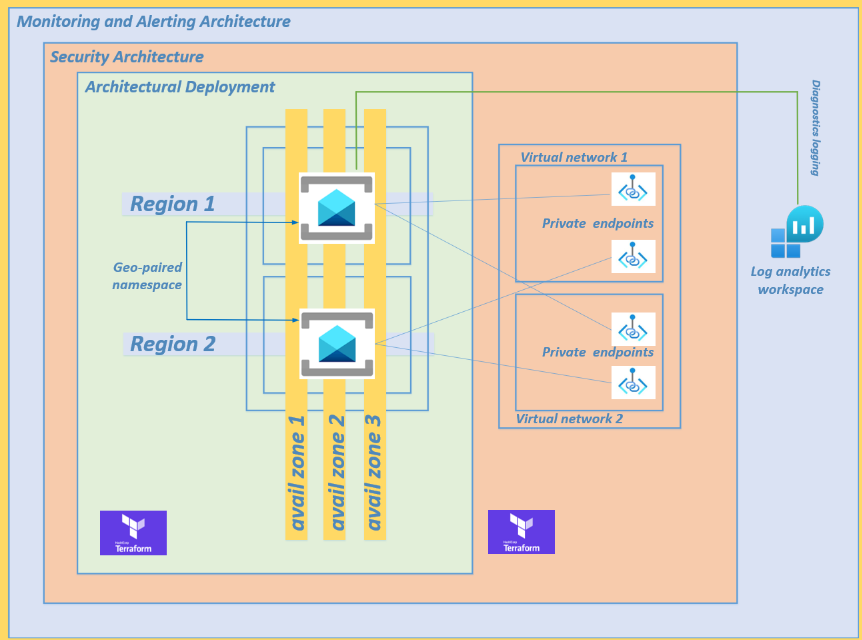
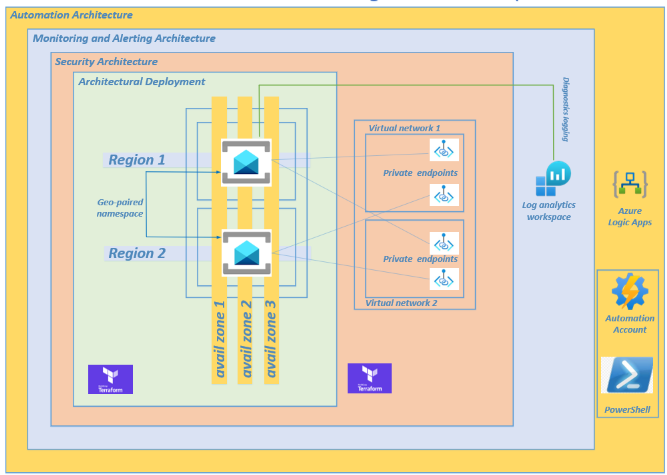
Deployment Steps
Step 1 - Enable your subscription
Enable the Microsoft.ServiceBus on your subscription using azure cli:
#show current subscription focus:
az account show
#enablement:
az provider register --namespace Microsoft.ServiceBus
#verification:
az provider show --namespace Microsoft.ServiceBus --query "registrationState"
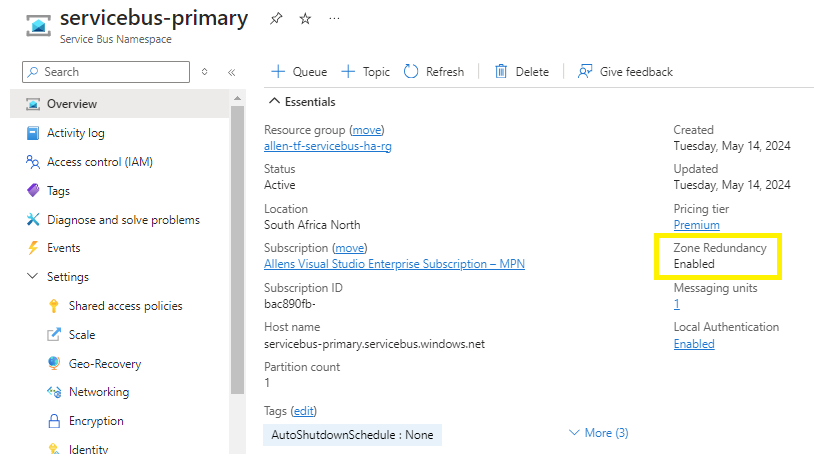
Step 2 - Provisioning across 3 availability zones in each region
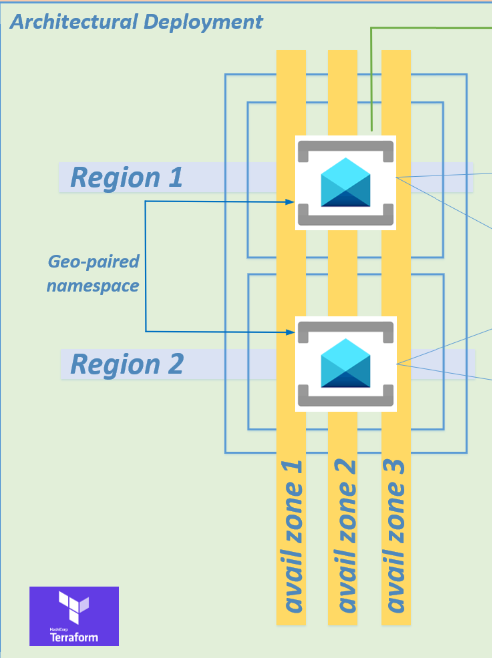
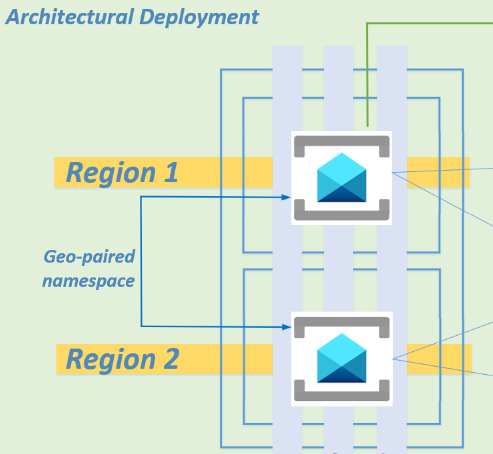
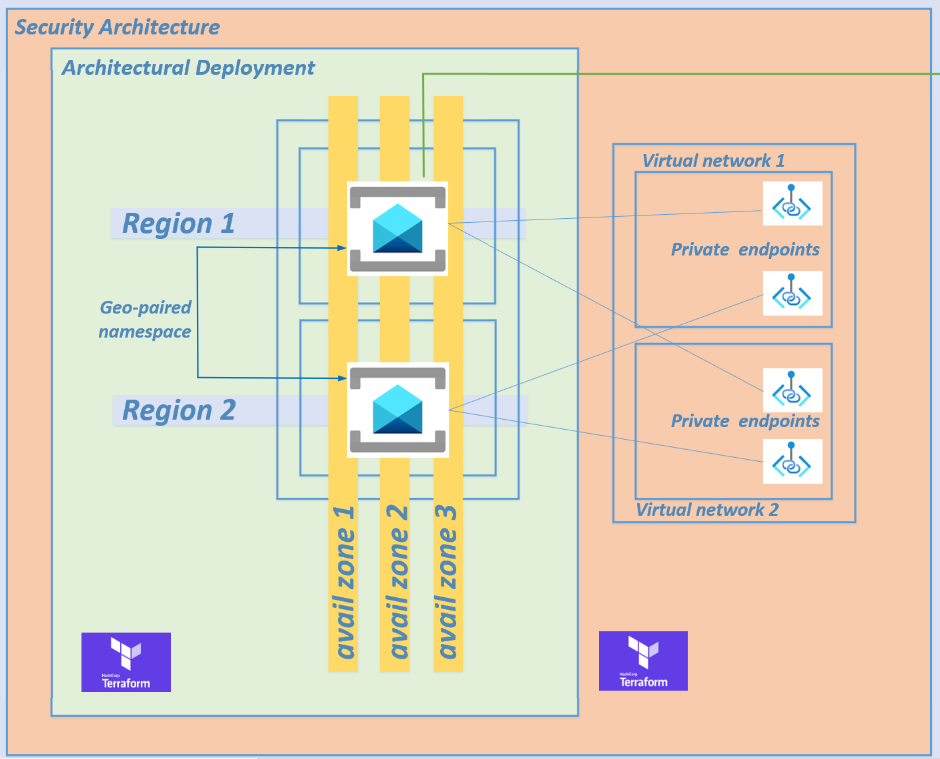
I have written a Terraform script to provision the Azure Service Bus geo-paired namespaces as high availability across 3 availability zones in each region to satisfy any high availability requirements.
There is no additional cost for enabling availability zones. You cannot disable or enable availability zones after namespace creation.
Refer to step 4 and step 5 of the Terraform script.
Part 2 - The architectural design and deployment of the Azure Service Bus geo-paired namespace across two Azure regions (disaster recovery)
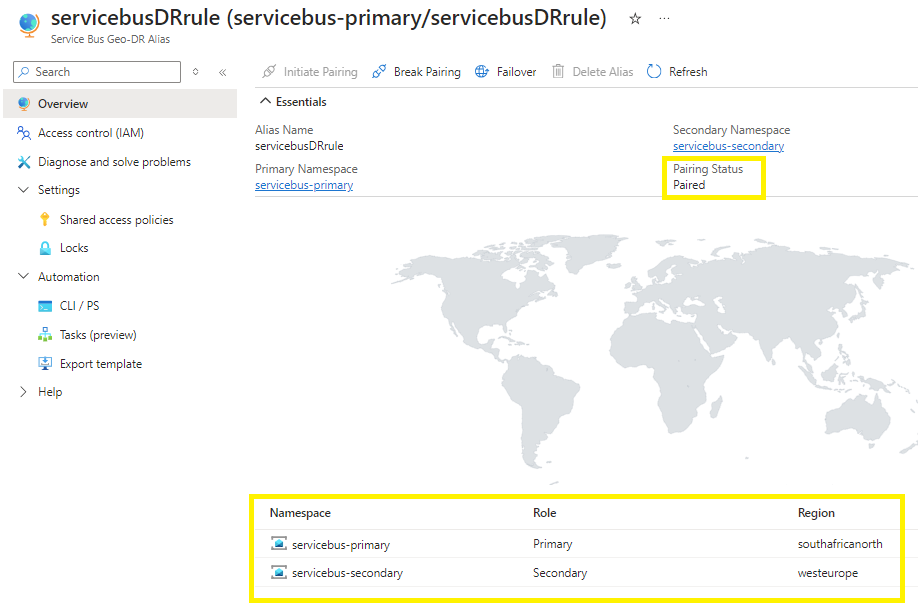
Step 3 – Provisioning across 2 Azure regions
The Terraform script will deploy your Azure Service Bus geo-paired namespaces across two Azure regions using a geo-paired namespace, satisfying disaster recovery requirements.
Refer to step 6 and step 7 of the Terraform script.
Step 4 - Provisioning private endpoints
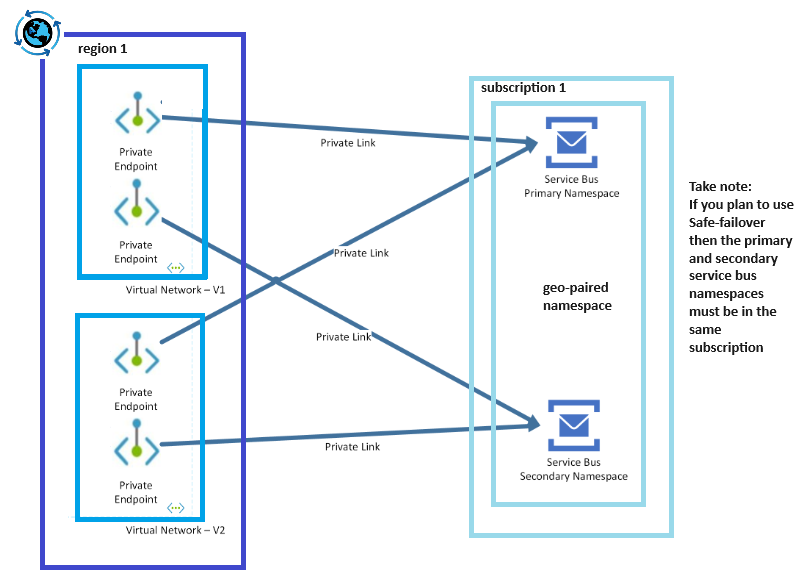
Lets harden your architecture by overlaying a security pattern over your Azure Service Bus geo-paired namespace deployments by implementing private endpoints to prevent any traffic traversing the public internet.
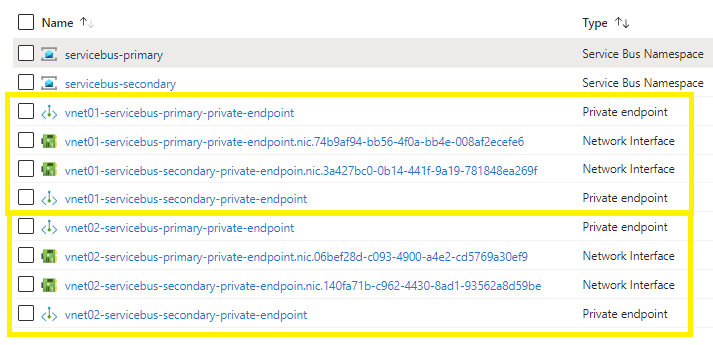
I have provisioned four private endpoints across 2 virtual networks. Your virtual networks may be in the same or multiple regions. Be aware of the inter-regional traffic costs.
Refer to step 8 and step 9 in the Terraform script.
Step 5 - Provision Monitoring and alerting
Provisioning monitoring and alerting of your Azure Service Bus namespace deployments,
A log analytics workspace is provisioned in step 10 of the Terraform script from which we will run Kusto Queries to provision the alerting platform.
The Terraform script deploys the log analytics workspace but does not configure the diagnostics logging.
You will need to configure diagnostic logging as per your bespoke primary namespace/s that you plan to monitor (in the next step),
Step 6 – Diagnostics monitoring
6.1 Connect to your Azure Monitor Workspace
A great source of logs can be collected from the Azure Monitor subscription activity logs connected workspace.
The Azure Service Bus monitoring data, including logs and metrics, is collected and analyzed using Azure Monitor. To generate the log analytics table for Azure Service Bus with the specific query you’ve provided, you would connect to the AzureDiagnostics table in the Log Analytics Workspace connected to the subscription activity logs. This table stores the diagnostic logs for various Azure services, including Azure Service Bus.
6.2 Connect your Primary Service Bus Namespace
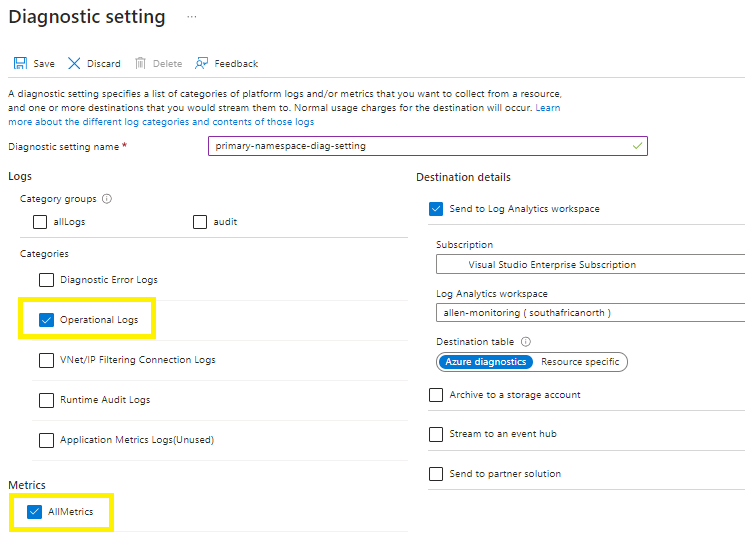
Go to your Azure service bus primary namespace > diagnostic settings >
Select your choice of logs based on what metrics you plan to monitor here.
(Remember that logs are cost consumptive based on data at rest and data in transit to your log analytics workspace, so choose carefully),
I chose Operational Logs and AllMetrics to only monitor the management plane of the Azure Service Bus namespace,
Select your collection endpoint > log analytics workspace,
After the initial setup, the log analytics workspace will take around 3 hours to seed with log data. Thereafter, the Azure monitor logs take < 10 minutes to sync to the log analytics workspace every time an event occurs.
Step 7 - Provision your Kusto Query

The Azure Service Bus monitoring data, including logs and metrics, is collected and analyzed using Azure Monitor. To generate the log analytics table for Azure Service Bus with the specific query you’ve provided, you would use the AzureDiagnostics table in Log Analytics. This table stores the diagnostic logs for various Azure services, including Azure Service Bus. You need to link the log analytics workspace to the Azure Monitor and scope at subscription level.

Write and run your KQL Query: Use the Kusto Query Language to write a query that checks the operational logs for the status of the Service Bus namespace or any of the data elements in your namespace.
The results will show you the last time the namespace was active or search for errors | failures.
AzureActivity
| where TimeGenerated > ago(1h)
| where ActivityStatusValue == "Failure"
Step 8 - Testing the Kusto Query
Go to your Log Analytics Workspace > Logs > and paste and customize your Kusto Query based on your bespoke environment.
AzureActivity
| where TimeGenerated > ago(1h)
| where ActivityStatusValue == "Failure"
Part 5 – Provisioning an automation platform architecture to automate the failover of your Azure Service Bus geo-paired namespace
Step 9 – Provision your Automation Account
The PowerShell script below helps to deploy an Azure automation account with a system assigned managed identity enabled.
Enablement of the SAMI is essential for the running of the PowerShell script.
Follow my blog here on how to provision a new automation account and with the preparation for PowerShell:
Step 10 - Add a ServiceBus Module
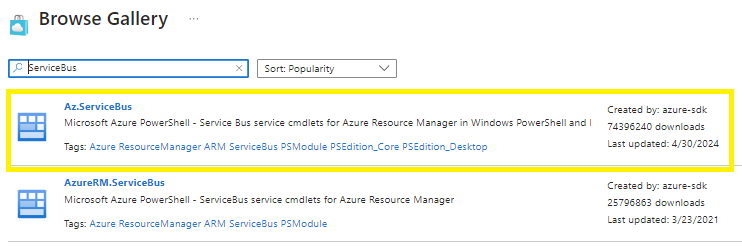
After step 9, an additional module is required to import the Start-AzServiceBusGeoDRFailOver,
Go to Modules > + Add a module >
Browse from gallery > click on the browse from gallery link > Do a search for Servicebus and select the module Az.ServiceBus > Import
Step 11 – Create your Runbook
Search for runbooks and + Create a runbook
Enter your bespoke descriptive name,
Select the runbook type as PowerShell,
Select a runtime version as recommended,
Enter a descriptive description,
Review and Create > Create,
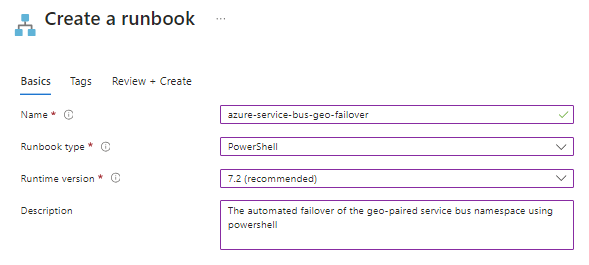
Step 12 - Edit PowerShell Runbook
The aim of this PowerShell script is to achieve a safe failover for an Azure Service Bus geo-paired namespace from the primary namespace to a secondary namespace.
NOTE: The PowerShell script is dependent on the enablement of the automation account SAMI with RBAC role permissions of Contributor.
#VARIABLES
$subscriptionName = 'Allens Visual Studio Enterprise Subscription'
$ResourceGroupName = 'allen-tf-servicebus-ha-rg'
$primaryNamespace = 'servicebus-primary'
$secondaryNamespace = 'servicebus-secondary'
$GeoRecoveryNamespaceAlias = 'disaster-recover-rule'

#Step 1 - Connect to Azure with your SAMI
Connect-AzAccount -Identity
Set-AzContext -Subscription $subscriptionName

#Step 2 - Initiate the failover
Set-AzServiceBusGeoDRConfigurationFailOver -ResourceGroupName $ResourceGroupName -NamespaceName $secondaryNamespace -Name 'servicebusDRrule'

#Step 3 - After failover > break the pairing
Set-AzServiceBusGeoDRConfigurationBreakPair -ResourceGroupName $ResourceGroupName -NamespaceName $primaryNamespace -Name 'servicebusDRrule'
After pasting the PowerShell code into your runbook, select Save

Verification:
Make sure to have executed the Terraform script in your sandbox so that all the resources and pairing are in place.
To verify that your runbook works in your sandbox, click on Testpane > Start
Once your Test runs successfully, you will receive a completed message

In the portal you can confirm that your pairing is updating
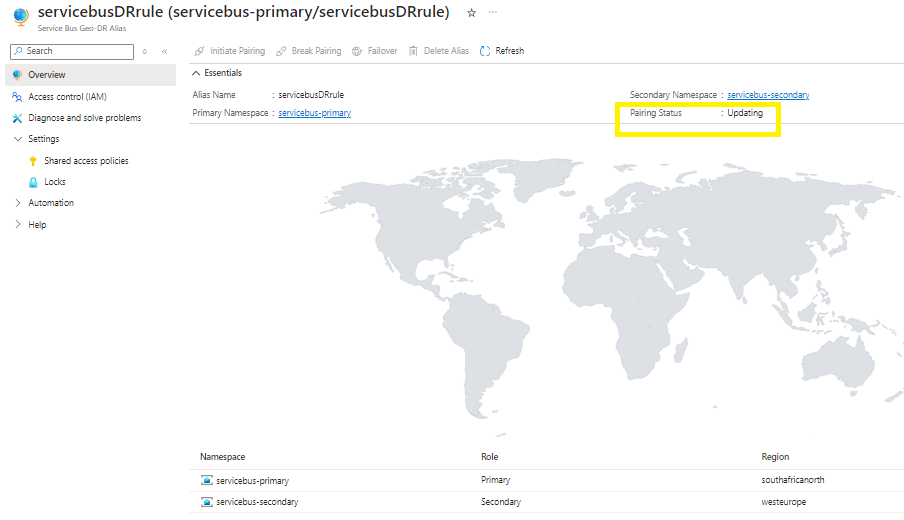
Until you notice the end state of no geo pairing.
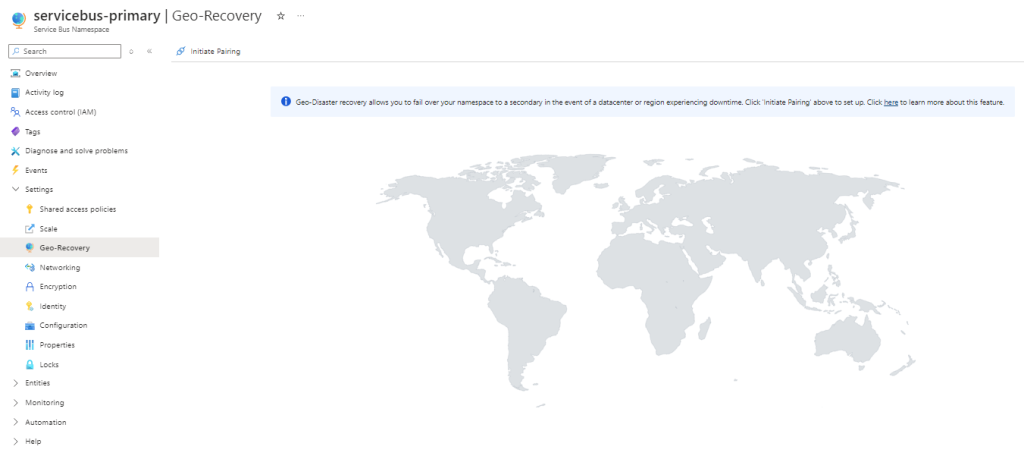
If you go to your secondary service bus namespace, you will see logs showing a successful Failover has taken place.

Publish your runbook
This runbook will be incorporated into your automated logic app or power automation platform.

NOTE:
This automation account manual test will have failed over your geo-paired namespace and broken the pairing. Before continuing with the demonstration, you will have to run a Terraform destroy to delete all the resource and then run Terraform apply to recreate all the resources before we can test the logic app automation flow.
Configuring your Automation Flow
Decide on whether to configure a Power Automation or Logic Apps automation platform. (I dont have a Power Automation license on my sandbox so Im building out on Logic Apps).
Step 12 – Create your Logic App
Create a simple Consumption based logic app.
Refer to my pricing section for more details.
Step 13 - Enable Logic App SAMI
We are going to run the designer actions against the SAMI account
Go to the Logic App Identity,
Enable the System Identity > ON > Save >
Enable system assigned managed identity > Yes >
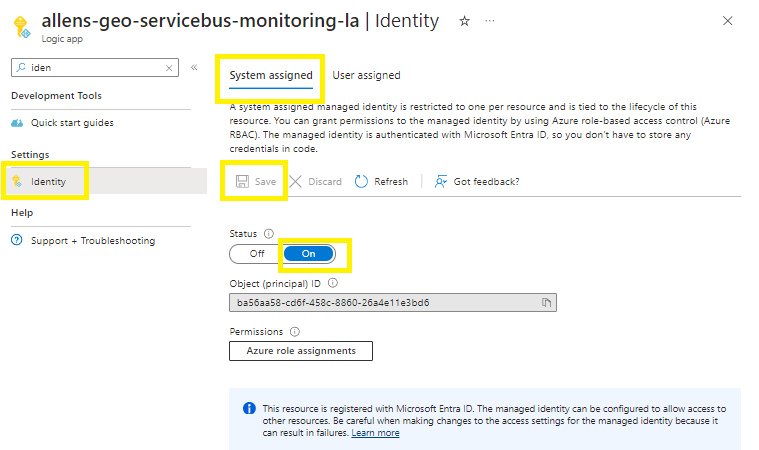
Step 10 - Logic App SAMI RBAC role
Select Azure role assignments button under the system assigned tab >
+ Add role assignment > select Monitoring Reader and Contributor
Save

Step 11 - Logic App Designer
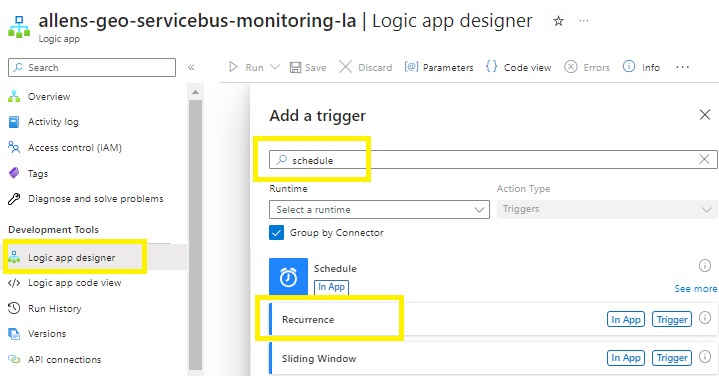
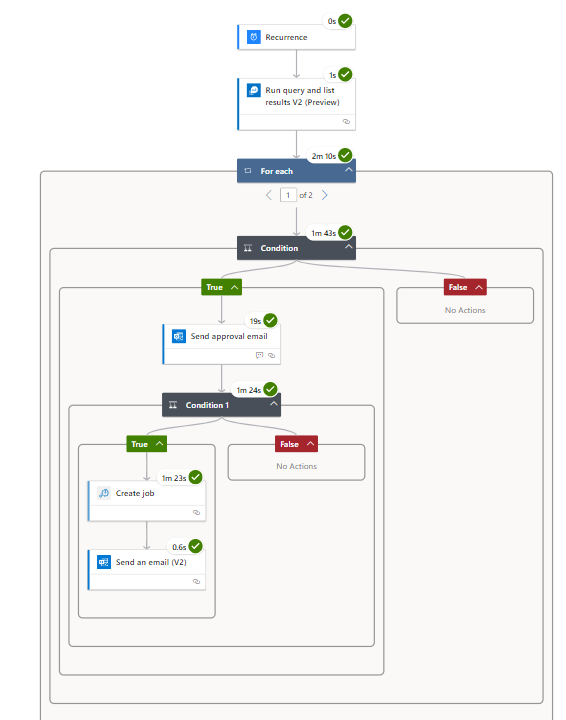
Add a trigger > Recurrence schedule,
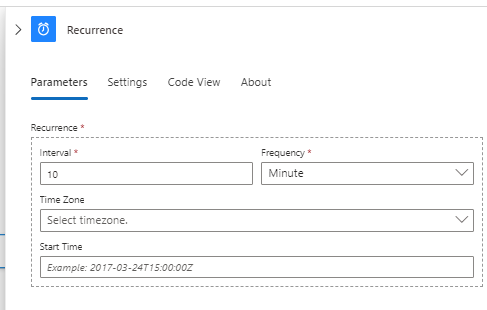
Configure a 10 minute frequency (the Azure Monitor takes < 10 minutes to sync log data to the log analytics workspace),
Save,
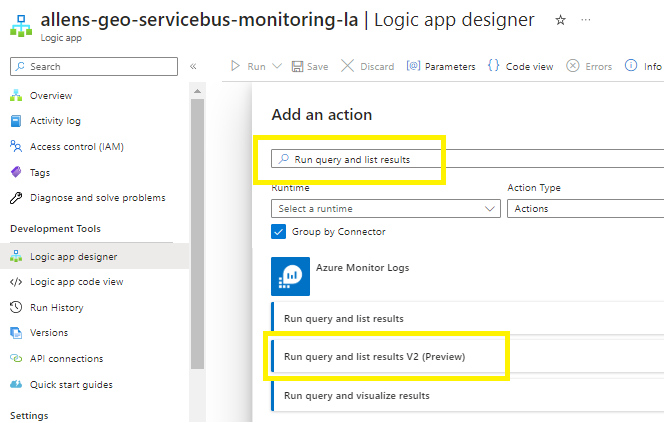
Add an action
Select Run query and list results
Create your bespoke connection name and select the Logic Apps MI (you are going to reference the logic app SAMI you enabled earlier),
Click on Create New
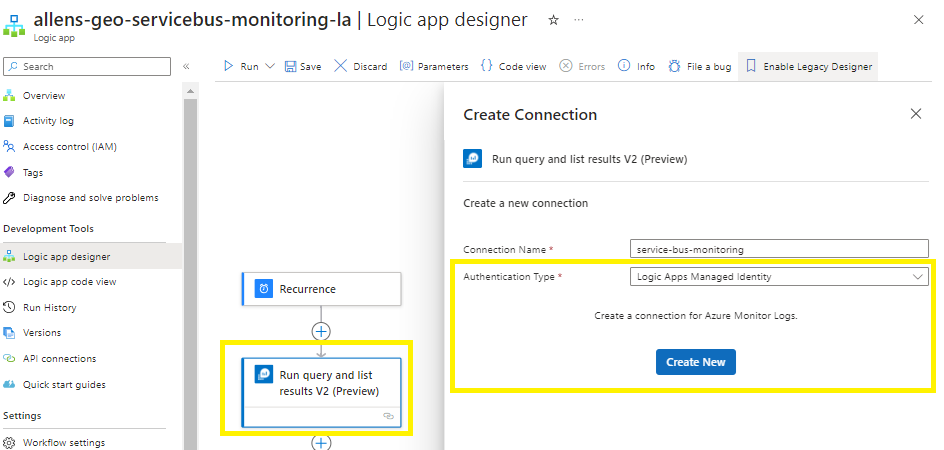
Click on Create New
Populate the pre-tested KQL query from earlier,
Now find the source log analytics workspace:
Select the destination subscription, resource group, resource type (log analytics workspace),
Resource name, and date range
Add an action
Add a control condition (to choose what to do if the Kusto Query returns a positive result),
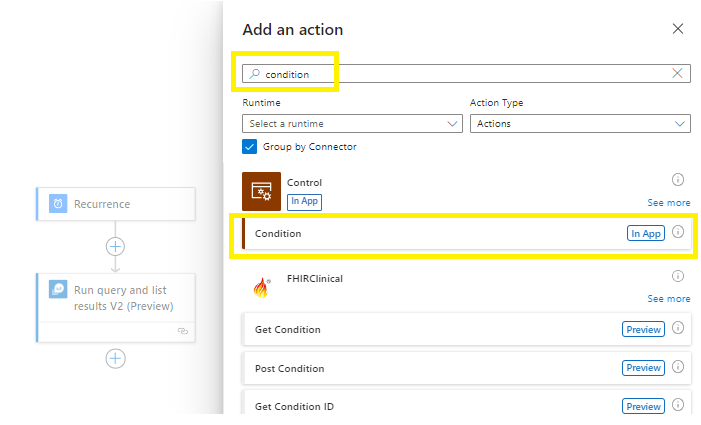
Click on the value space and select the dynamic content list.
Add the dynamic content value based on your Kusto Query search criteria. Leave the other values empty as you have already defined the search criteria in your Kusto Query.
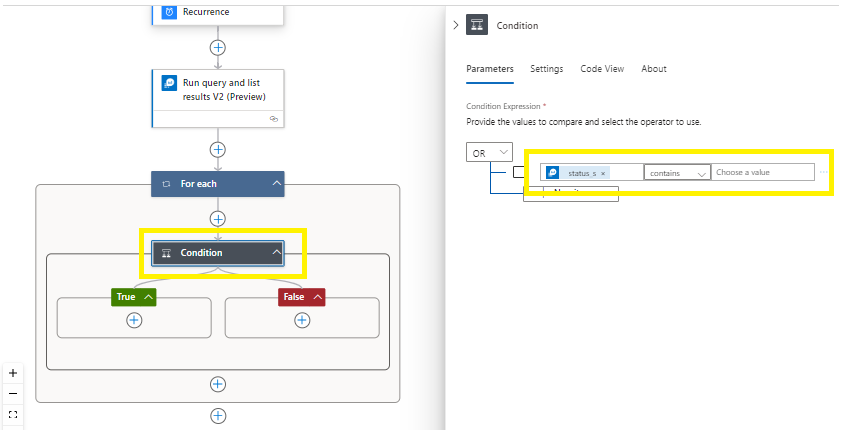
Save your work,
Now select the True branch and setup an alert that needs to be sent to an approver when your selected metric condition is satisfied (eg when an Azure Service Bus namespace Error is created within the defined time period in your Kusto Query),
Add an action,
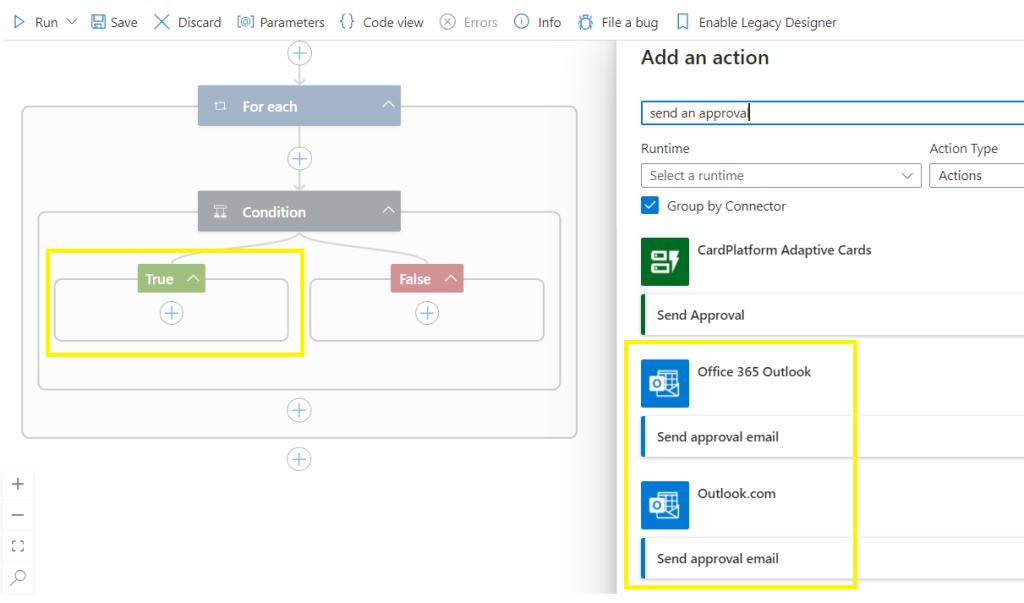
Search and select Send an approval email
Select your preferred email platform,
Setup your distribution group email address,
Select a body from the advanced parameters,
Change the importance to High,
Customize your Subject line,
Take note of the User Options Approve | Reject. We will be using this later.
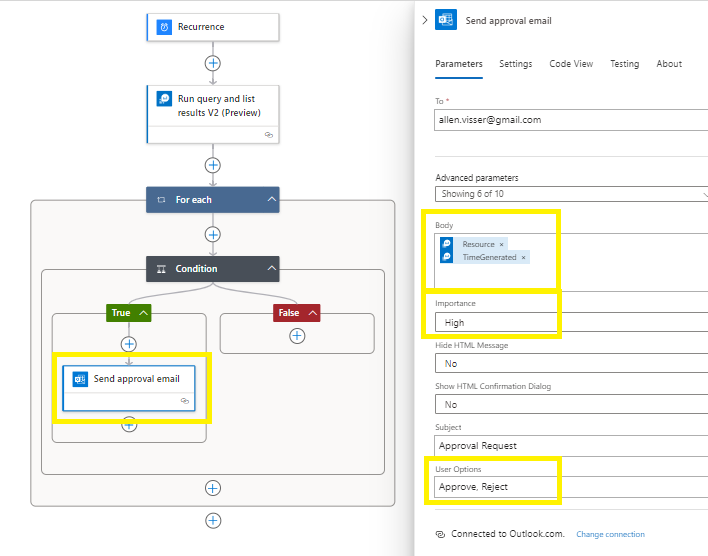
Save and Run the designer to test functionality,
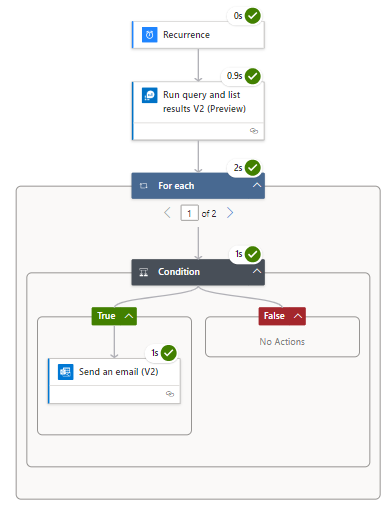
Step 12 – Approver notification
Your designated approver should get an approval email if the logic app conditions are met,
Select Approve to initiate the remainder of the flow,
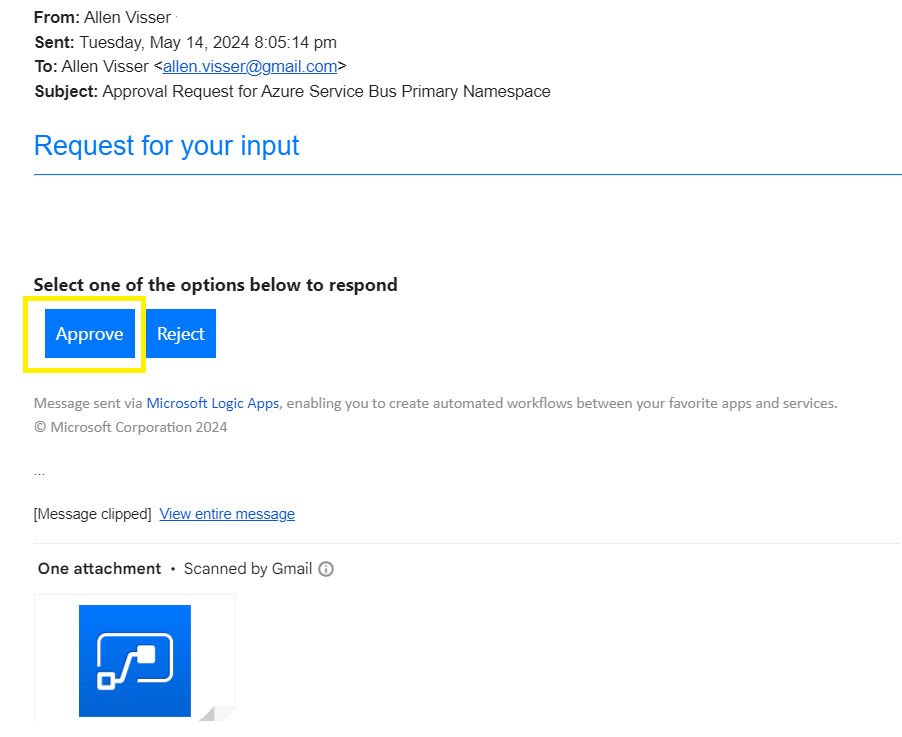
Upon selecting Approve the approval banner will appear,

Add an Action,
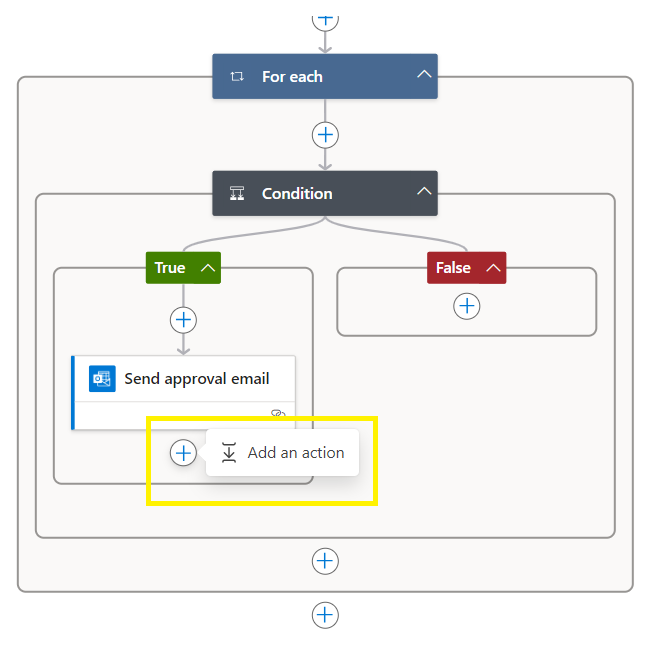
Search and add a second control condition
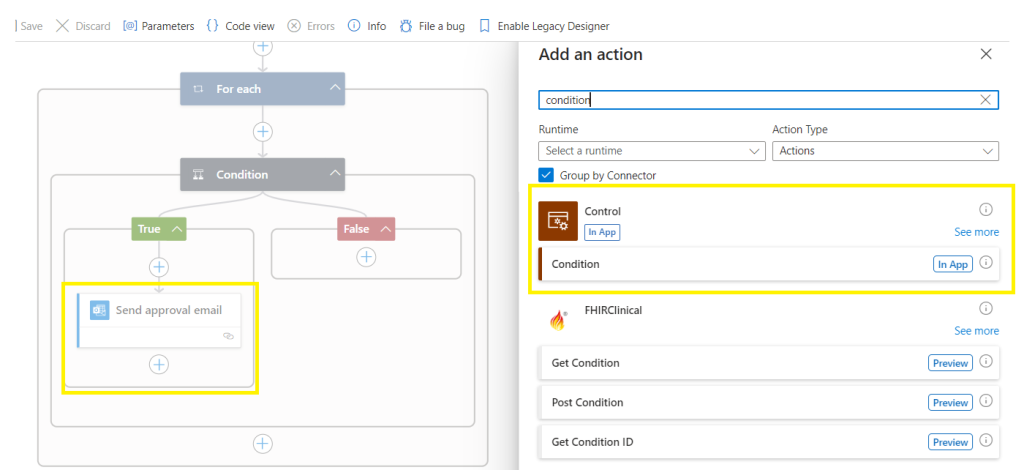
In the condition, search dynamic content for SelectedOption,
In the next section, type in Approve (case sensitive with trimming)
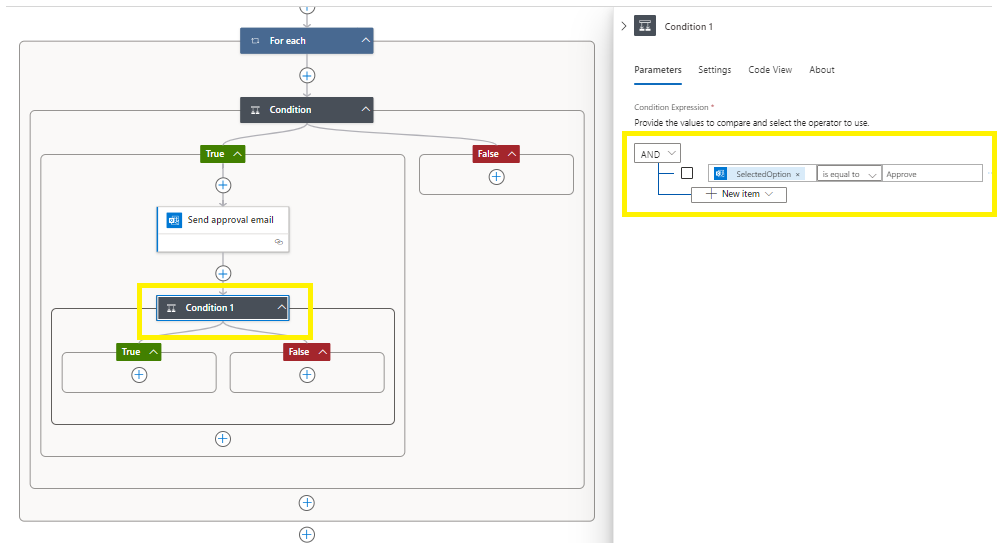
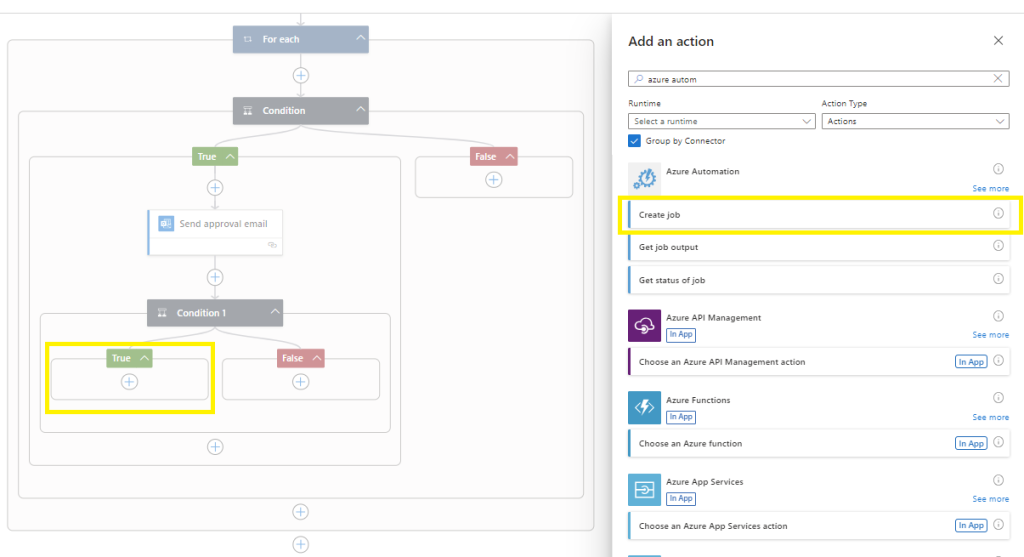
Go to True and select Add an action,
Search for azure automation,
Select Create job,
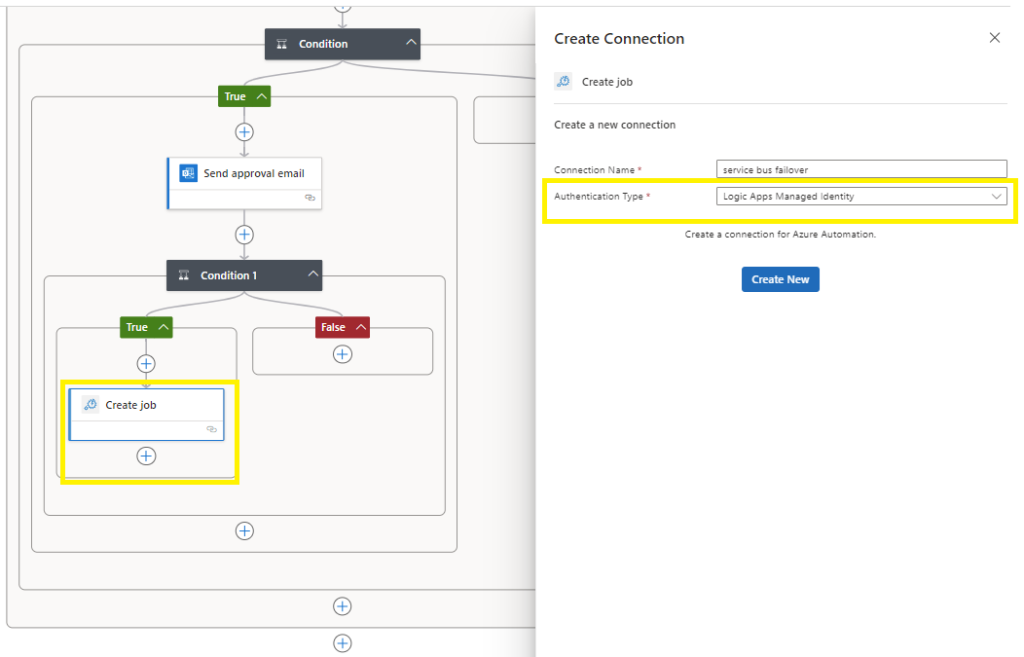
Create a connection name and select the Authentication Type of Logic Apps Managed Identity (which requires you to have configured the RBAC role of Contributor across the subscription as completed earlier),
Create new,
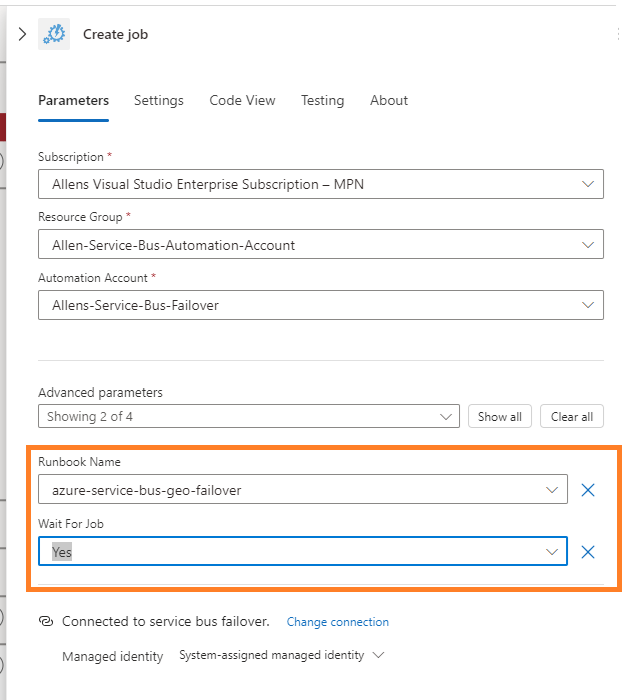
In the Create job section,
Point to the previously created Automation Account,
Point to your target Automation Account > subscription, resource group and AA name,
Now open your Advanced parameters and select your Runbook Name (without this vital runbook name, your execution will fail) > and populate your runbook name,
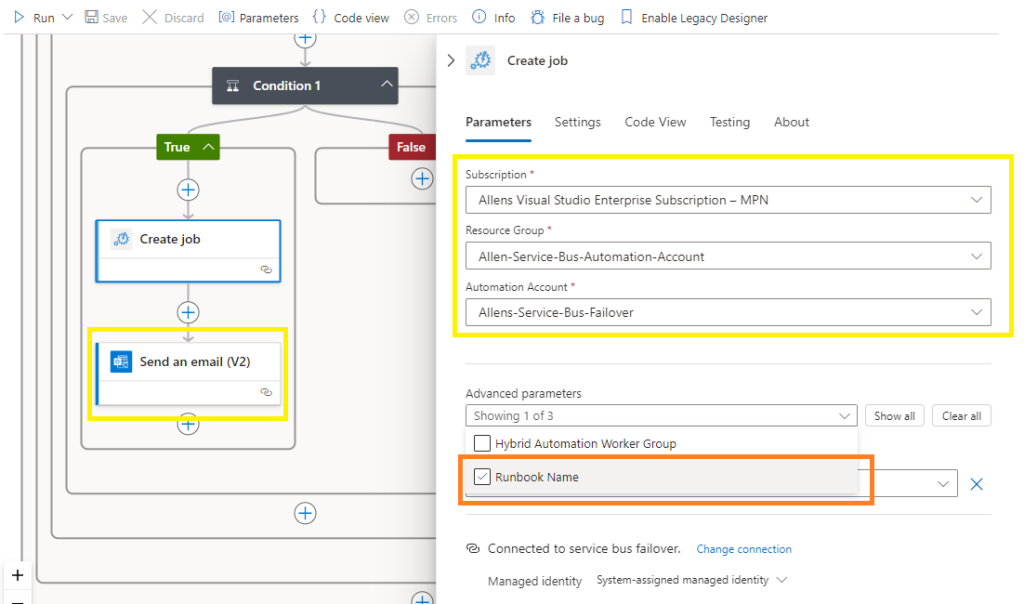
With your Runbook name inserted, select to wait for the Automation Account job to finish running before moving onto the next step.
Save your designer,
Add an action,
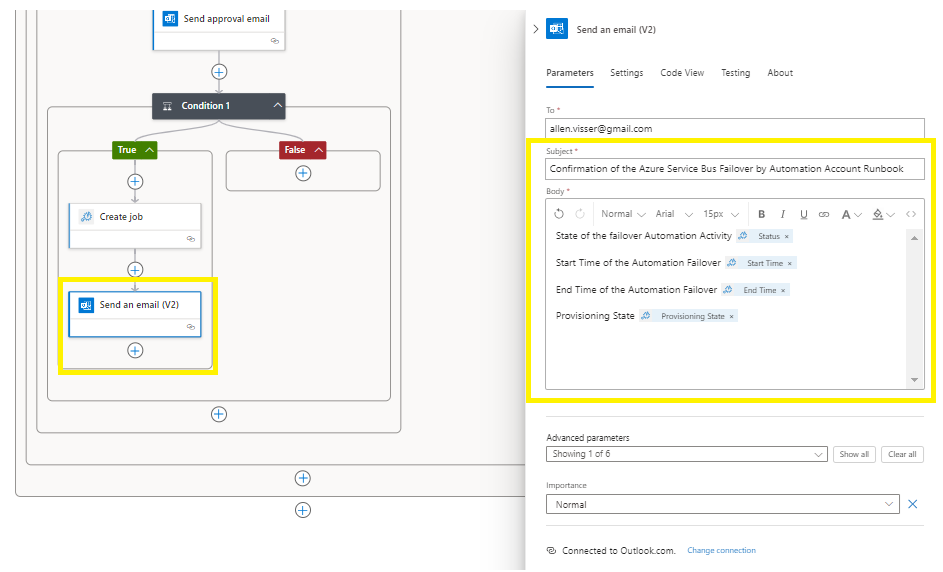
Send an email (v2) on your chosen platform,
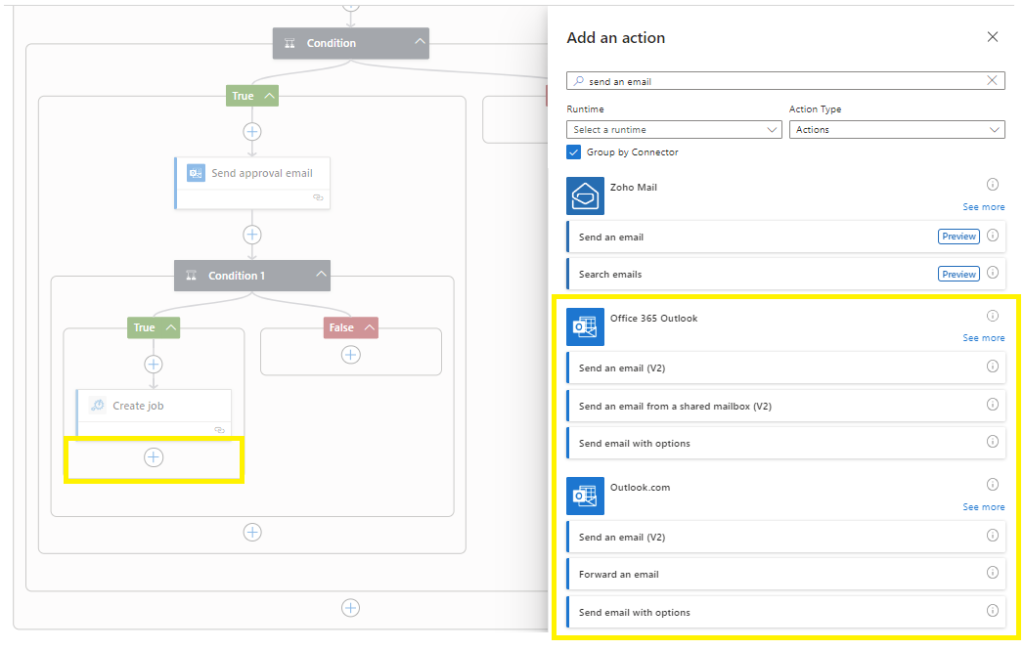
Complete the email fields and to whom the confirmation email must be sent,
Save and Run the designer to test functionality,
Upon successful completion, the approver would receive a confirmation email.
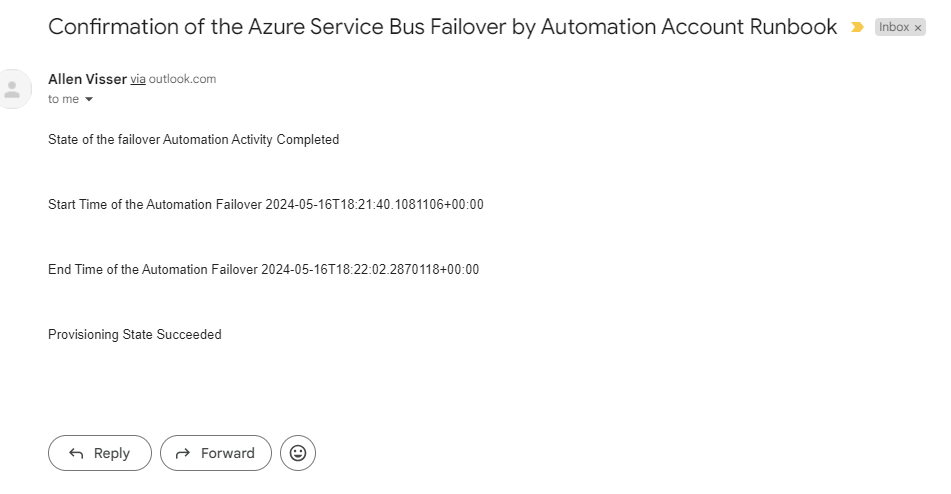
Verification

You should see your logic app flow run to completion.
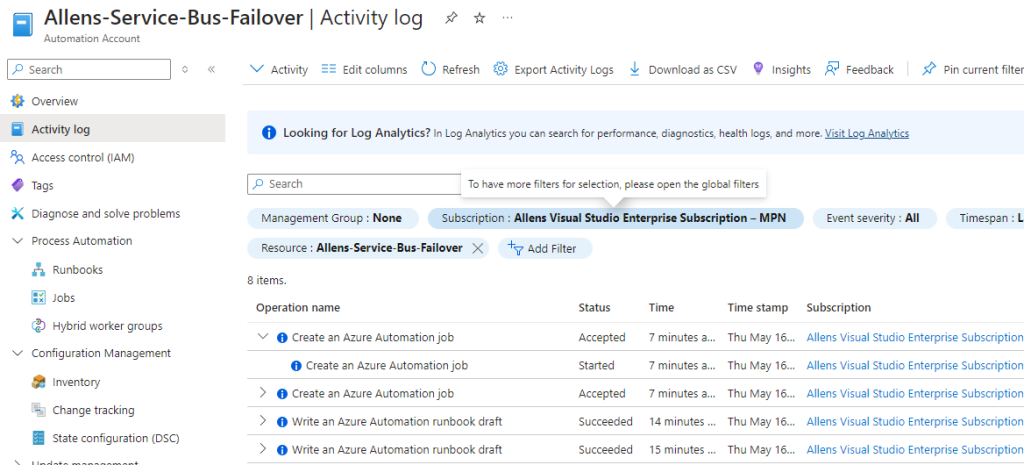
You will also be able to view the Automation Account Activity logs to verify that the automation job executed to failover the Service Bus Namespaces and break the pairing.
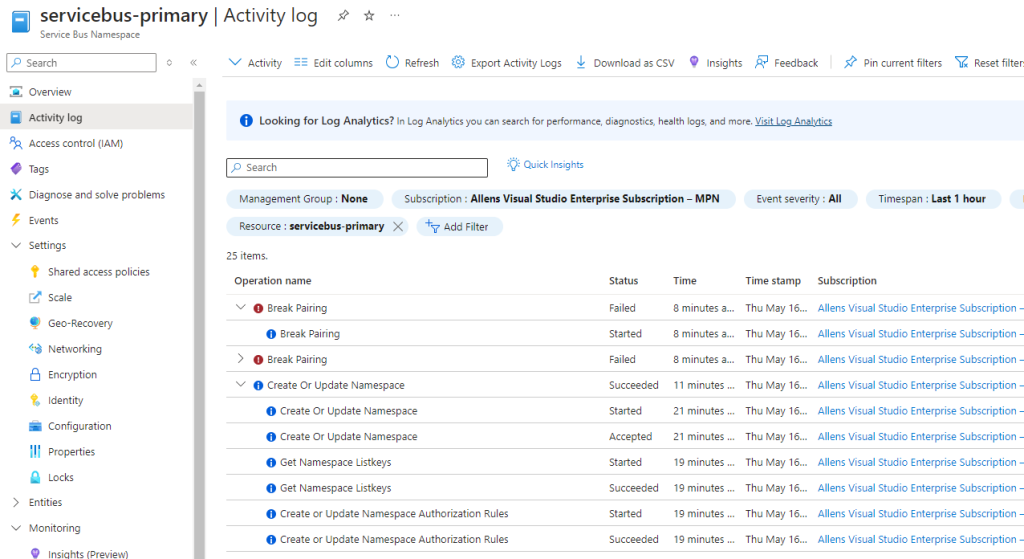
You will also be able to view the (Primary) Service Bus Activity logs to verify that the break pairing did in fact begin. (Im not sure why the error is produced when the pairing break does take place successfully),
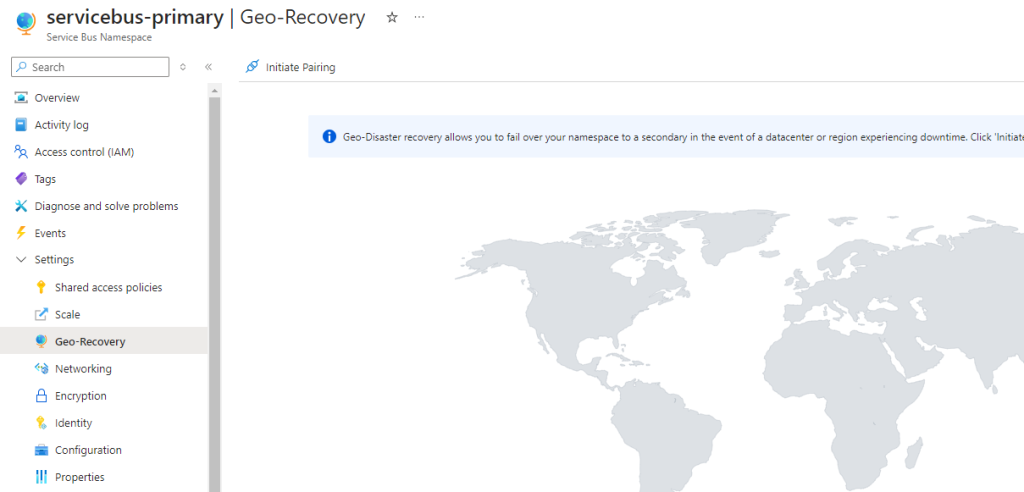
The final verification is to check the primary service bus namespace and verify that the failover has taken place and the pairing has in fact been broken.
Consumption App Pricing
— I hope this blog helped you with the automation of your geo-paired Azure Service Bus namespace —-
